
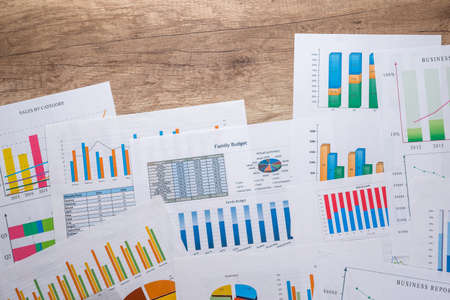
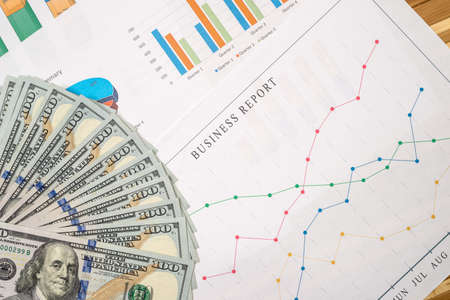
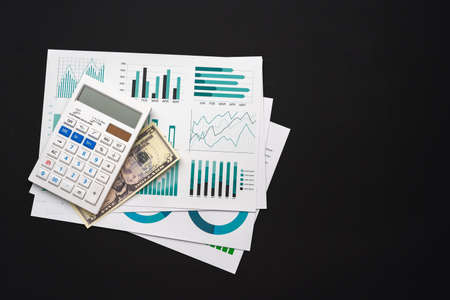
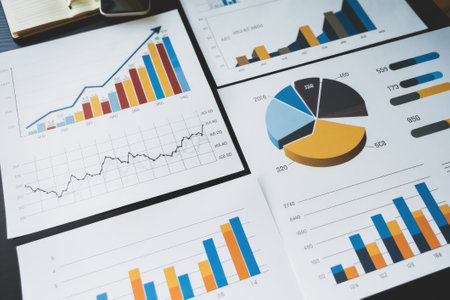
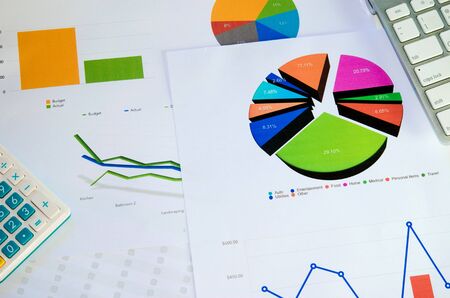
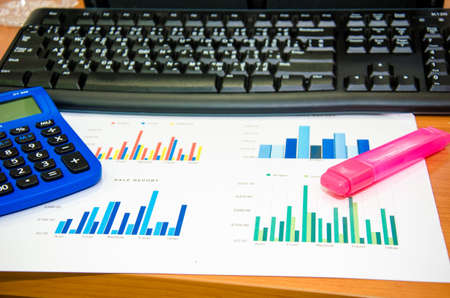
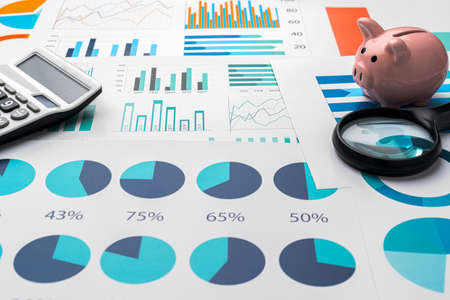
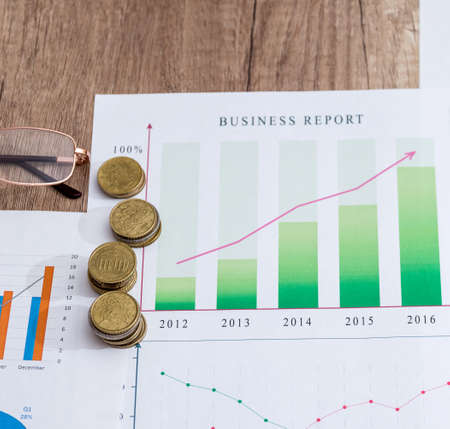
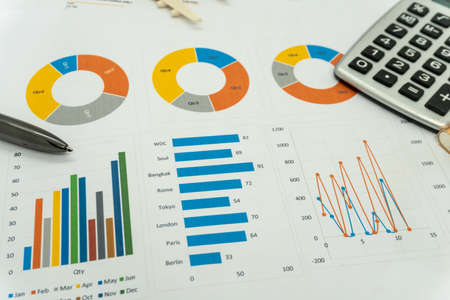
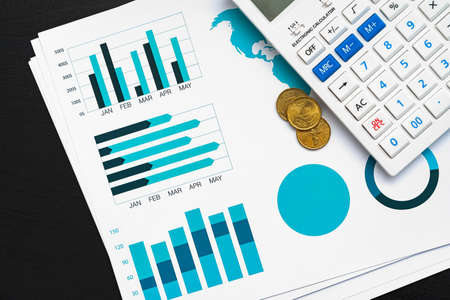
many different business graph with calculator and pen on desk.
Коллекция по умолчанию
Коллекция по умолчанию
Создать новую

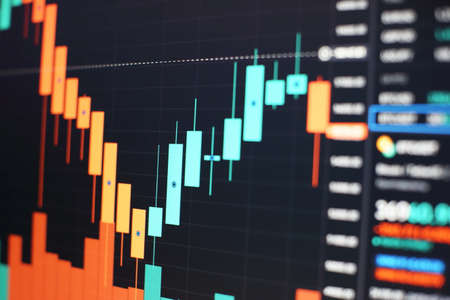
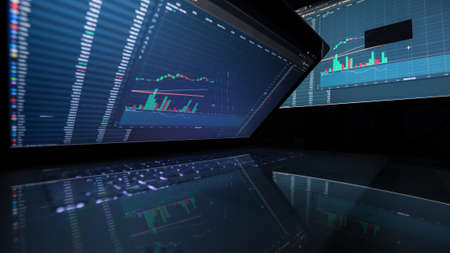
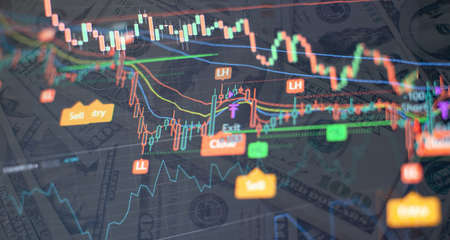
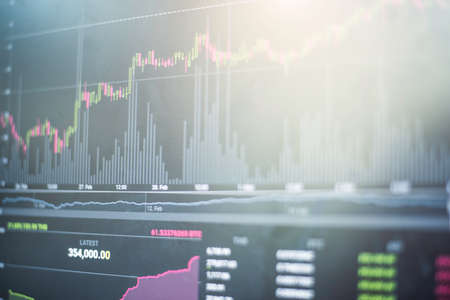
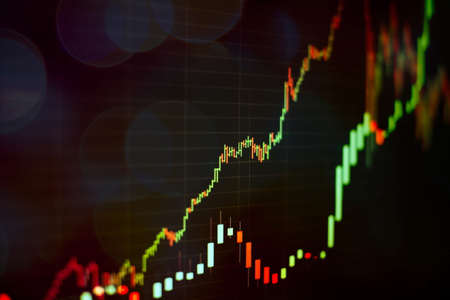
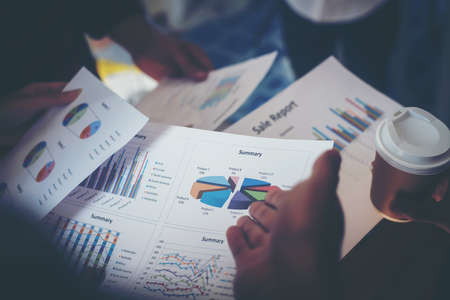
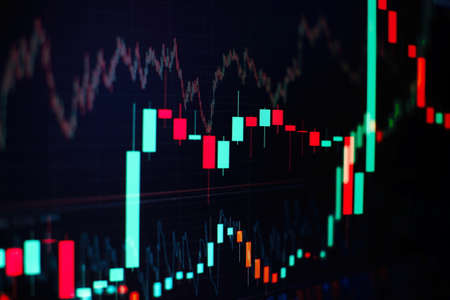
Shallow depth of field (selective focus) with details of a chart showing the stock market crash from March 2020 due to the Covid-19 pandemic on a computer screen (S&P500 index)
Коллекция по умолчанию
Коллекция по умолчанию
Создать новую
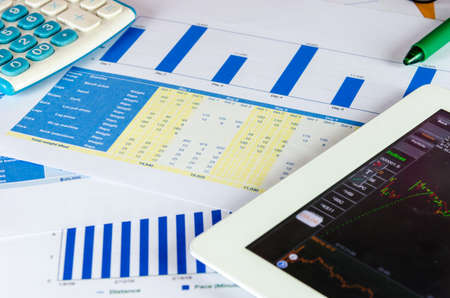
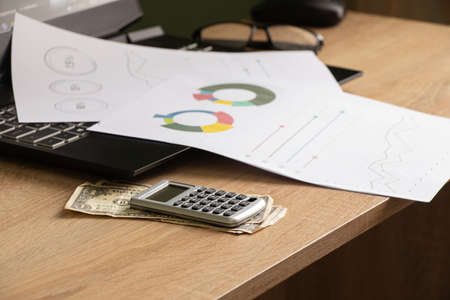
20 and 50 euro banknotes and wallet and cigar on wood background
Коллекция по умолчанию
Коллекция по умолчанию
Создать новую

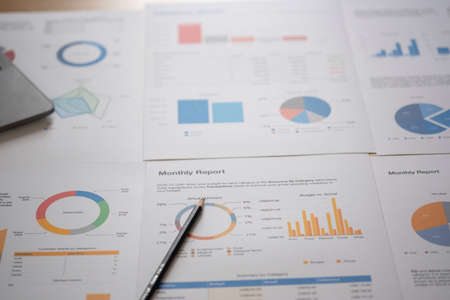
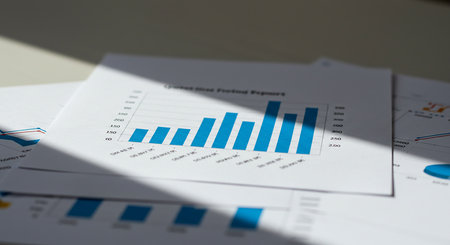
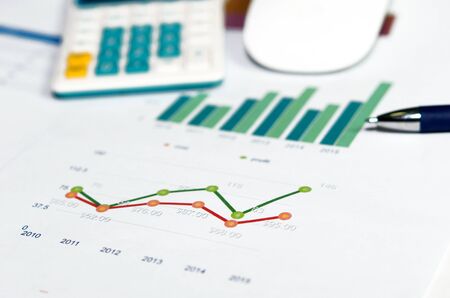
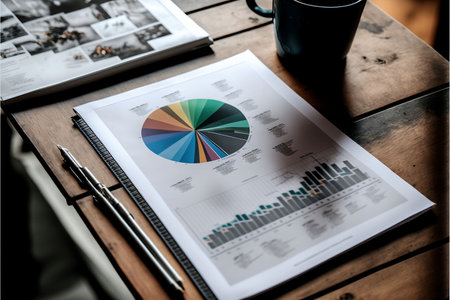
ballpoint pen indicates income graphs lying on the table
Коллекция по умолчанию
Коллекция по умолчанию
Создать новую
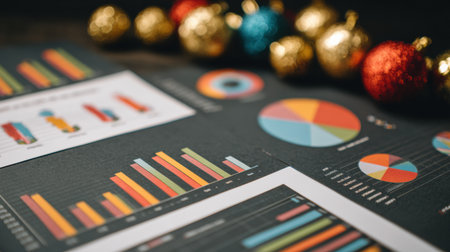
Charts and graphs display data insights on a table, while vibrant holiday ornaments add a festive touch to the workspace, creating a cheerful atmosphere.
Коллекция по умолчанию
Коллекция по умолчанию
Создать новую
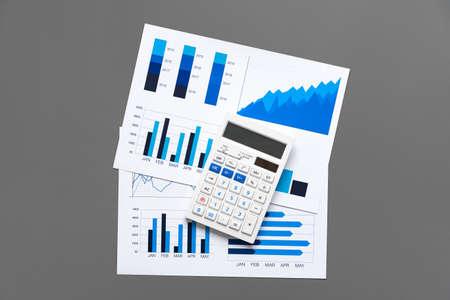
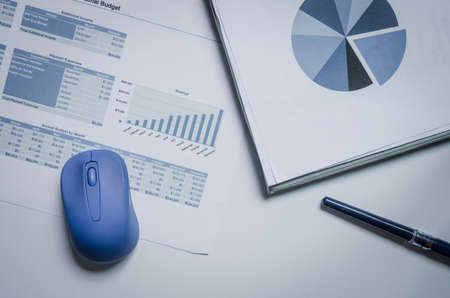
Financial paper with charts and diagrams on gray table
Коллекция по умолчанию
Коллекция по умолчанию
Создать новую

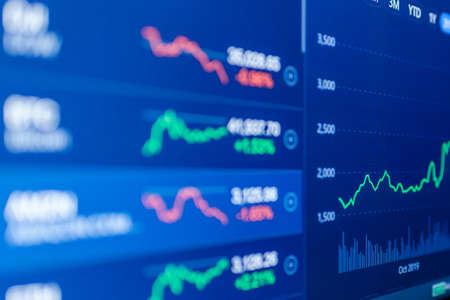
Business financial or stock market background. Business graph on stock market financial exchange
Коллекция по умолчанию
Коллекция по умолчанию
Создать новую
Year plan with calculator and money
Коллекция по умолчанию
Коллекция по умолчанию
Создать новую

Financial stock market graph. Stock Exchange. Selective focus.
Коллекция по умолчанию
Коллекция по умолчанию
Создать новую
business data graph on laptop with copy space for making meeting presentation, professional businessman busy work on the business data graph
Коллекция по умолчанию
Коллекция по умолчанию
Создать новую

Business plan documents and charts for eco-tourism startup on rustic wooden table
Коллекция по умолчанию
Коллекция по умолчанию
Создать новую

Financial instruments with various types of indicators including volume analysis for professional technical analysis
Коллекция по умолчанию
Коллекция по умолчанию
Создать новую
Close up view, asian businessman use finger touching on mobile screen to cheak set index of stocks and analyze chart on paperwork for investment plan
Коллекция по умолчанию
Коллекция по умолчанию
Создать новую
Stock market graph and business. Stock or business market analysis concept.
Коллекция по умолчанию
Коллекция по умолчанию
Создать новую
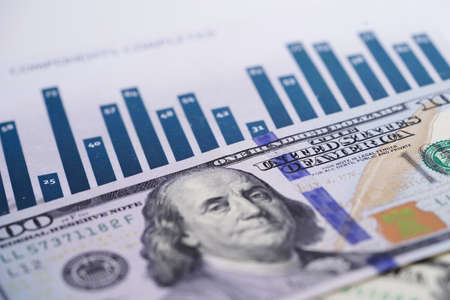
business graph with us dollar, close up
Коллекция по умолчанию
Коллекция по умолчанию
Создать новую
Charts Graphs paper. Financial development, Banking Account, Statistics, Investment Analytic research data economy, Stock exchange Business office company meeting concept.
Коллекция по умолчанию
Коллекция по умолчанию
Создать новую

image of the financial graph on a computer monitor.
Коллекция по умолчанию
Коллекция по умолчанию
Создать новую
Workplace of business analyst, graphs and diagrams on table
Коллекция по умолчанию
Коллекция по умолчанию
Создать новую

business graph with pen
Коллекция по умолчанию
Коллекция по умолчанию
Создать новую
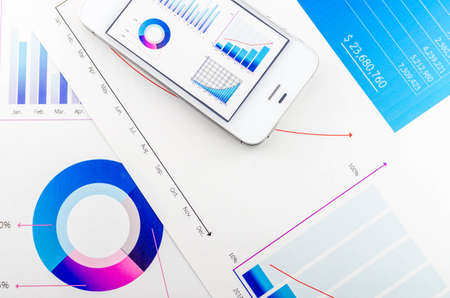
Business chart with smart phone and pen
Коллекция по умолчанию
Коллекция по умолчанию
Создать новую

Close-up of a stock market analysis chart with a mix of bar graphs and line graphs highlighting key data
Коллекция по умолчанию
Коллекция по умолчанию
Создать новую
Business graphs paper and calculator on table
Коллекция по умолчанию
Коллекция по умолчанию
Создать новую
relax, de-stress, holiday, happy, Asian woman relaxing at home listening to music from smartphone and laptop happily.
Коллекция по умолчанию
Коллекция по умолчанию
Создать новую

Charts Graphs paper. Financial development, Banking Account, Statistics, Investment Analytic research data economy, Stock exchange Business office company meeting concept.
Коллекция по умолчанию
Коллекция по умолчанию
Создать новую

Financial stock market graph. Stock Exchange. Selective focus.
Коллекция по умолчанию
Коллекция по умолчанию
Создать новую

Team work with results and reports
Коллекция по умолчанию
Коллекция по умолчанию
Создать новую
Business of financial analytics desktop with accounting charts and diagrams
Коллекция по умолчанию
Коллекция по умолчанию
Создать новую

Financial accounting of profit summary graphs analysis.
Коллекция по умолчанию
Коллекция по умолчанию
Создать новую
US dollar banknote money on chart graph paper. Financial development, Banking Account, Statistics, Investment Analytic research data economy, trading, Business company concept.
Коллекция по умолчанию
Коллекция по умолчанию
Создать новую
Business table with bar chart graphs.
Коллекция по умолчанию
Коллекция по умолчанию
Создать новую
Business paperwork present with diagram.
Коллекция по умолчанию
Коллекция по умолчанию
Создать новую
Financial paper with charts and diagrams on gray table
Коллекция по умолчанию
Коллекция по умолчанию
Создать новую

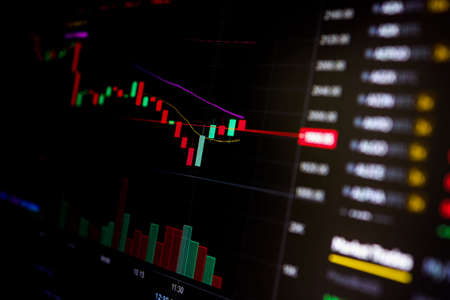
Shallow depth of field (selective focus) with details of a candlestick chart on a computer screen.
Коллекция по умолчанию
Коллекция по умолчанию
Создать новую

US dollar banknotes on chart and graph paper, Finance, Account, Statistics, Investment, Analytic research data economy and Business company concept.
Коллекция по умолчанию
Коллекция по умолчанию
Создать новую
Volume analysis for professional technical analysis on the monitor of a computer. Fundamental and technical analysis concept.
Коллекция по умолчанию
Коллекция по умолчанию
Создать новую

Analysis of data from graphs. select focus.
Коллекция по умолчанию
Коллекция по умолчанию
Создать новую

Fundamental and technical analysis concept.
Коллекция по умолчанию
Коллекция по умолчанию
Создать новую
Stock exchange market chart background. Candle stick graph chart with indicator.
Коллекция по умолчанию
Коллекция по умолчанию
Создать новую
Business reports Teamwork on table report of documents Blue graphs and charts financial paperwork and reports
Коллекция по умолчанию
Коллекция по умолчанию
Создать новую
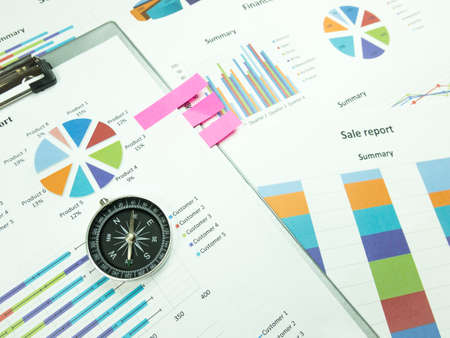
Business report chart and Financial graph analysis with compass on table.
Коллекция по умолчанию
Коллекция по умолчанию
Создать новую
Concept of saving investment, stock, income, profit of business
Коллекция по умолчанию
Коллекция по умолчанию
Создать новую
financial charts and graphs on the table of the businessman, business concept
Коллекция по умолчанию
Коллекция по умолчанию
Создать новую

A stock market graph on a black background.
Коллекция по умолчанию
Коллекция по умолчанию
Создать новую

Business chart with line graph, bar chart and numbers on dark background, 3d rendering. Computer digital drawing.
Коллекция по умолчанию
Коллекция по умолчанию
Создать новую
Saving stack coins money concept. Graph, chart document close up
Коллекция по умолчанию
Коллекция по умолчанию
Создать новую
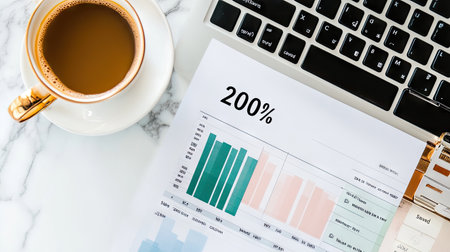
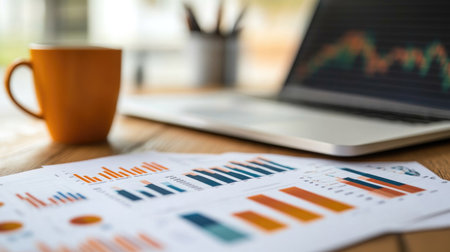
A modern workspace scene featuring a cup of coffee beside a laptop, with charts and graphs showcasing data analysis for productivity and business growth.
Коллекция по умолчанию
Коллекция по умолчанию
Создать новую

Abstract candlestick chart on white digital screen. Stock market or crypto data chart, graph with rectangular grid on light background.
Коллекция по умолчанию
Коллекция по умолчанию
Создать новую

Annual business report. Accountability paperwork. Hands holding a heap of documents with graphs and statistics
Коллекция по умолчанию
Коллекция по умолчанию
Создать новую

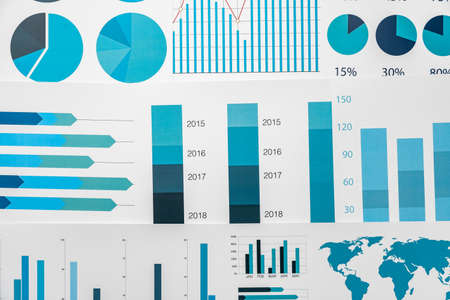
Many type of infographic diagram over white background. Top view.
Коллекция по умолчанию
Коллекция по умолчанию
Создать новую
Business documents showing positive growth and financial success through charts and graphs
Коллекция по умолчанию
Коллекция по умолчанию
Создать новую
Finance and accounting business, business planing, accounting
Коллекция по умолчанию
Коллекция по умолчанию
Создать новую
Documents, graphs on a desk.
Коллекция по умолчанию
Коллекция по умолчанию
Создать новую

Sales profit numbers changing on monitor after global trade, real time exchange market stocks statistics growing. Financial graphs showing money trend, risk buying. Close up. Tripod shot.
Коллекция по умолчанию
Коллекция по умолчанию
Создать новую

Indicators including volume analysis for professional technical analysis on the monitor of a computer. Fundamental and technical analysis concept.
Коллекция по умолчанию
Коллекция по умолчанию
Создать новую
Laptop screen with stock market charts. Technical analysis and fundamental indicators of stock quotes in the trading terminal. Japanese candlesticks and company tickers.
Коллекция по умолчанию
Коллекция по умолчанию
Создать новую
Business documents and tablet on the table
Коллекция по умолчанию
Коллекция по умолчанию
Создать новую
Business graphs and magnifying glass on table
Коллекция по умолчанию
Коллекция по умолчанию
Создать новую

Analyzing financial statistics and analyzing a market data. Data analysis from charts and graphs
Коллекция по умолчанию
Коллекция по умолчанию
Создать новую

Trader investor broker holding finger using cell phone app executing financial stock trade market trading order to buy or sell
Коллекция по умолчанию
Коллекция по умолчанию
Создать новую

euro cent and dollar cent on business chart and pen.
Коллекция по умолчанию
Коллекция по умолчанию
Создать новую
Graphs and phone
Коллекция по умолчанию
Коллекция по умолчанию
Создать новую

Colored sticker stripes on business analytics chart closeup
Коллекция по умолчанию
Коллекция по умолчанию
Создать новую

Stock market or forex trading graph in futuristic concept with copyspace
Коллекция по умолчанию
Коллекция по умолчанию
Создать новую
Financial paper with charts and diagrams on gray table
Коллекция по умолчанию
Коллекция по умолчанию
Создать новую
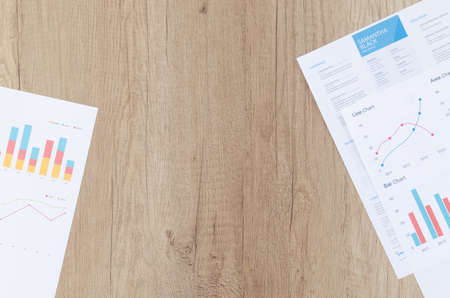
Workplace on wooden table with graph papers
Коллекция по умолчанию
Коллекция по умолчанию
Создать новую
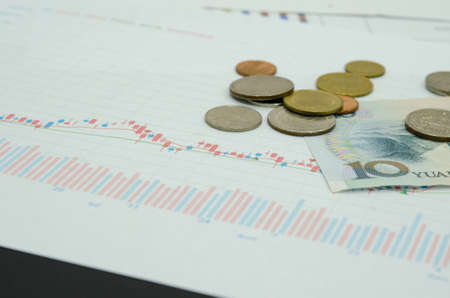
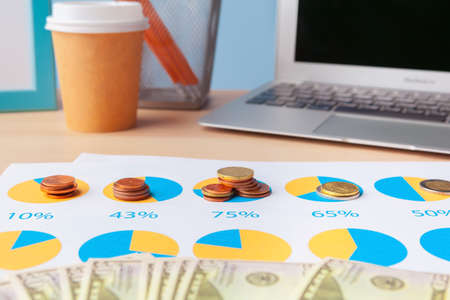
financial chart and coins on paper.
Коллекция по умолчанию
Коллекция по умолчанию
Создать новую

Businessmen miniature figure standing on investment and profit graph for analysis and discussion.
Коллекция по умолчанию
Коллекция по умолчанию
Создать новую

Virus pandemic covid-19 map on pc screen, global infection, internet.
Коллекция по умолчанию
Коллекция по умолчанию
Создать новую

top view of man hand with pen analyzing bar chart on paper.
Коллекция по умолчанию
Коллекция по умолчанию
Создать новую

Abstract glowing forex chart interface wallpaper. Investment, trade, stock, finance and analysis concept.
Коллекция по умолчанию
Коллекция по умолчанию
Создать новую

Vibrant candlestick patterns and descending trend lines illustrate a market downturn, highlighting analysis tools amid a somber financial atmosphere.
Коллекция по умолчанию
Коллекция по умолчанию
Создать новую
price graph and indicator, red and green candlestick chart on blue theme screen, market volatility, up and down trend. Stock trading, cryptocurrencies background.
Коллекция по умолчанию
Коллекция по умолчанию
Создать новую
Chart graph paper. Financial development, Banking Account, Statistics, Investment Analytic research data economy, trading, Business company concept.
Коллекция по умолчанию
Коллекция по умолчанию
Создать новую
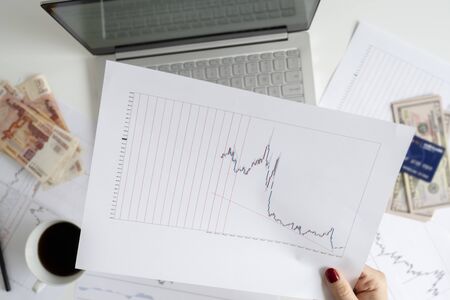
Woman freelancer. pack of banknotes fifty U.S. dollars, five thousand rubles, credit card and laptop with graphics and charts on office table. Forex exchange concept, Flat lay.
Коллекция по умолчанию
Коллекция по умолчанию
Создать новую

Stock market or forex trading graph in graphic concept suitable for financial investment or Economic trends business idea and all art work design.
Коллекция по умолчанию
Коллекция по умолчанию
Создать новую

indicators including volume analysis for professional technical analysis on the monitor of a computer. Fundamental and technical analysis concept.
Коллекция по умолчанию
Коллекция по умолчанию
Создать новую
Grow Stock market trading graph in graphic concept.financial investment or economic trends business design. Abstract finance background.Low angle shot.
Коллекция по умолчанию
Коллекция по умолчанию
Создать новую

Financial stock market graph. Stock Exchange. Selective focus.
Коллекция по умолчанию
Коллекция по умолчанию
Создать новую
Stock exchange, cryptocurrency price chart on a screen. Candlestick chart, btc. Online currency exchange market. Trading, bidding. Tracking the cryptocurrency rate. 4K. Close up.
Коллекция по умолчанию
Коллекция по умолчанию
Создать новую

Business success and growth concept. Stock market business graph chart on digital screen. Forex market, Gold market and Crude oil market.
Коллекция по умолчанию
Коллекция по умолчанию
Создать новую

Financial paper charts and graphs on the table.Business Concept
Коллекция по умолчанию
Коллекция по умолчанию
Создать новую
Stock graph on computer on black background.
Коллекция по умолчанию
Коллекция по умолчанию
Создать новую
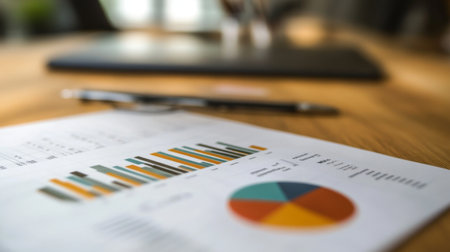
A focused workspace with coffee, laptop, and printed data charts reflects business analysis. Ideal for themes of productivity and data-driven decision-making.
Коллекция по умолчанию
Коллекция по умолчанию
Создать новую
A close-up of a printed gold price chart with annotations and trend lines, placed on a desk with financial reports and a pen, emphasizing detailed market analysis.
Коллекция по умолчанию
Коллекция по умолчанию
Создать новую
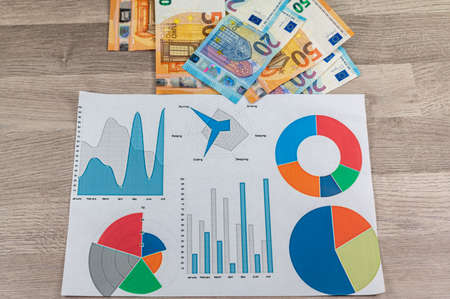
diagram with euro money
Коллекция по умолчанию
Коллекция по умолчанию
Создать новую
Business documents displaying various financial charts, graphs, and reports are spread across a wooden desk, offering insight into quarterly earnings and revenue streams
Коллекция по умолчанию
Коллекция по умолчанию
Создать новую
Financial statistics, stock exchange prices summarized in candle stick chart.
Коллекция по умолчанию
Коллекция по умолчанию
Создать новую
business graph with coin on wiiden table
Коллекция по умолчанию
Коллекция по умолчанию
Создать новую
financial charts on the table with calculator and pen.
Коллекция по умолчанию
Коллекция по умолчанию
Создать новую

Online stock exchange application with information on screen, closeup
Коллекция по умолчанию
Коллекция по умолчанию
Создать новую
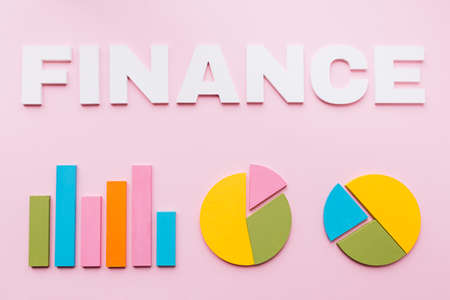
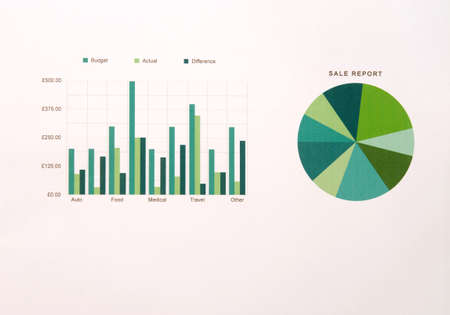
white finance text bar graph two pie chart pink background
Коллекция по умолчанию
Коллекция по умолчанию
Создать новую
A close-up view of business analysis documents showcasing colorful graphs and charts on a wooden table, symbolizing data studies and insights.
Коллекция по умолчанию
Коллекция по умолчанию
Создать новую
financial statement read and check number for business analysis
Коллекция по умолчанию
Коллекция по умолчанию
Создать новую
reports and histograms on paper on the table, analytics and statistics on paper, business analytics
Коллекция по умолчанию
Коллекция по умолчанию
Создать новую
An AI generated illustration of project management graphs charts paper
Коллекция по умолчанию
Коллекция по умолчанию
Создать новую
Technical price graph and indicator, red and green candlestick chart on blue theme screen, market volatility, up and down trend. Stock trading, crypto currency background.
Коллекция по умолчанию
Коллекция по умолчанию
Создать новую

Business and Economy Theme. Trading Cryptocurrencies. Stock Market Candles Chart on Computer Display Close Up.
Коллекция по умолчанию
Коллекция по умолчанию
Создать новую
Top view of table with financial papers and calculator
Коллекция по умолчанию
Коллекция по умолчанию
Создать новую
Business meeting coworkers discussing the project planning in office.
Коллекция по умолчанию
Коллекция по умолчанию
Создать новую
The Forex graph chart on the digital screen. Working set for analyzing financial statistics and analyzing a market data.
Коллекция по умолчанию
Коллекция по умолчанию
Создать новую
Legion-Media
Создайте свои проекты на основе качественных стоковых фотографий и видео.


Copyright © Legion-Media.